Contents
Dj-Charts YOOtheme PRO elements
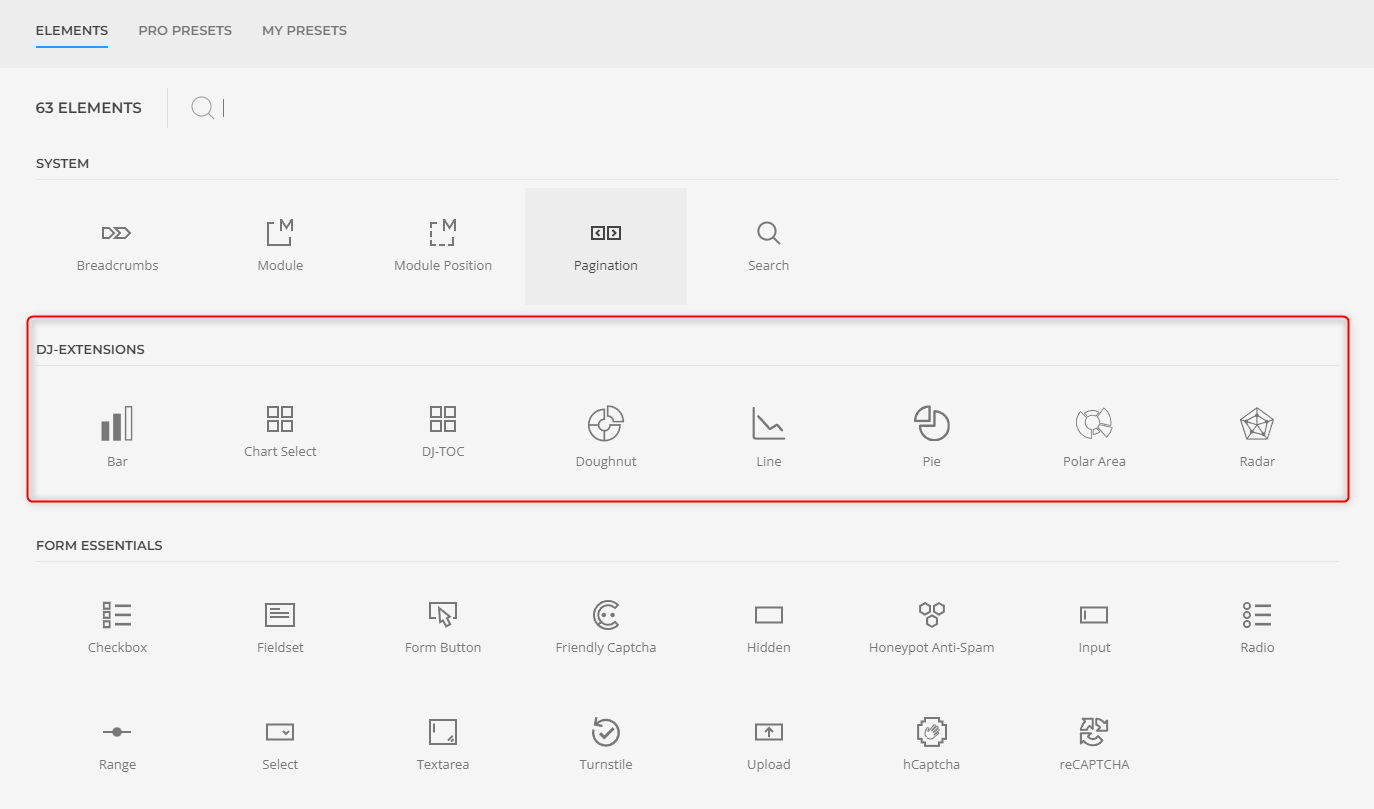
DJ-Charts has seven different elements - seven types of charts:
-
Chart select - selector to choose the chart
-
Bar - is a chart or graph that presents categorical data with rectangular bars with heights or lengths proportional to the values that they represent.
-
Doughnut - is a pie chart with its center cut out to look like a donut.
-
Line - is a way of plotting data points on a line. Often, it is used to show trend data, or the comparison of two data sets.
-
Pie - is a circular statistical graphic which is divided into slices to illustrate numerical proportion.
-
Polar Area - are similar to pie charts, but each segment has the same angle - the radius of the segment differs depending on the value.
-
Radar - A radar chart displays multivariate data stacked at an axis with the same central point. The chart features three or more quantitative variables for comparison; these variables are known as radii.